Apparent Downdrift Impacts of T-Head Groin Construction on a Salt Marsh, Hunting Island State Park, SC
Joel Bostic
Excerpts from 2014 undergraduate senior thesis that was ultimately published in a peer-reviewed scientific journal as follows:
Bostic, J., Tanner, B., and McDowell-Peek, K., 2015, Apparent Downdrift Impacts of T-Head Groin Construction on a Salt Marsh, Hunting Island State Park, SC. Southeastern Geology 51(2): 51-64.
These excerpts are being reprinted with permission from Southeastern Geology.
ABSTRACT
Hard stabilization was utilized in 2007 with the installation of six T-head groins in an attempt to reduce high rates of erosion on Hunting Island State Park, South Carolina. Groins trap littoral sediment on the updrift side while decreasing sediment supply downdrift. A salt marsh is located downdrift from one T-head groin, and appeared to be retreating at a greater rate post-groin installation. In order to quantify the salt marsh’s retreat rate, fourteen aerial images of Hunting Island from 1951-2013 were collected and analyzed using ArcMap 10.1. Wetland retreat rates were calculated for each set of chronologically successive images in addition to area measurements for each image. Obligate wetland vegetation, hydric soil indicators, and specific wetland hydrology were all present in the study area allowing for clear determination of wetland status. Average wetland retreat rates were significantly greater (p< 0.001) after T-head groin installation (-18.82 m/yr) than pre-groin installation (-2.19 m/yr). Total wetland retreat was 107 m in 57 years pre-groin installation, and 73 m in less than 6 years post-groin installation. Wetland area decreased by 69,000 m2 in 57 years pre-groin installation (1,210 m2/yr), and decreased by 39,800 m2 in less than 6 years post-groin installation (6,630 m2/yr). Due to the significantly greater average wetland retreat rates post-groin installation, we conclude that greater attention should be given, and possible effects considered, to salt marshes throughout permitting processes prior to installation of hard stabilization structures, as these wetlands are often protected at the state level and also under Section 404 of the federal Clean Water Act.
INTRODUCTION (Excerpts)
Sea-level rise and direct wetland destruction by humans have undoubtedly been, and continue to be, factors contributing to wetland loss. While other research focuses on the marine ecological impacts of hard stabilization structures (Bulleri and Chapman, 2009) and mangrove habitat response to seawalls in estuaries (Heatherington and Bishop, 2012), little work has been published related to hard stabilization structures and oceanfront wetland loss. The purpose of this study is to analyze whether T-head groins installed in 2007 on Hunting Island, South Carolina (Figure 1) have affected wetland erosion rates and contributed to an increased rate of wetland loss relative to pre-groin rates.
Groins reduce erosion by trapping littoral sediment on the updrift side while cutting off sediment supply downcoast (Duane, 1976; Komar, 1998). Hall and Pilkey (1991) include groins in their discussion of active erosion, defining them as structures that cause accelerated erosion. Six T-head groins were installed in 2007 on Hunting Island State Park, SC (Figure 2). T-head groins were installed in an attempt to reduce erosion on an island that has historically had some of the highest rates in the country at 6 m/yr (Baird & Associates, 1998; CSE, 2005). T-head groins include an impermeable structure extending perpendicularly away from shore designed to trap sediment with a head at the seaward end to diffract waves (Bodge, 2003). A salt marsh downdrift (to the north) from groin 2 is atypical in its position relative to the ocean (Figure 3). Salt marshes of the southeastern US typically form in low-energy environments such as lagoonal or estuarine settings, protected by an oceanfront barrier (USFWS, 1990). This salt marsh is positioned fronting the ocean and has lost significant area as Hunting Island has eroded.
Site Description
Hunting Island State Park is a 5,000 acre barrier island bordered by Harbor Island, Johnson Creek, and St. Helena Sound to the north and Fripp Inlet and Fripp Island to the south (Figure 1). It is typical of barrier islands on SC’s coast: Holocene in origin, oriented northeast-southwest, with a characteristic drumstick shape, a meso-tidal range, and ebb-tidal deltas (Hayes, 1979). For over 100 years, Hunting Island was eroding at a rate between 130,000 m3/yr and 230,000 m3/yr, or approximately 6 m of shoreline loss per year (CSE, 2005; Stapor and May, 1981). Longshore transport rates have averaged around 76,000-122,000 m3 to the north for the 20 year period from 1990-2010 (Traynum, Kana, and Simms, 2010). Hunting Island has a long history of beach nourishment projects that have temporarily slowed the impacts of erosion (Table 1). The first recorded use of hard stabilization on Hunting Island involved log groins in the early 1900’s (Kana, White, and McKee, 2004). A more permanent form of hard stabilization occurred in 1968 with construction of a terminal groin on the island’s north end (May and Stapor, 1996). Even with hard and soft stabilization efforts, monitoring reports of the 1991 nourishment indicate that after three years, 60-100% of fill had been lost from the three distinct nourishment areas (CSE, 1995).
With its consistently high rates of erosion, hard stabilization structures were proposed to augment nourishment (Baird & Associates, 1998). In 2006, nearly 500,000 m3 of nourishment fill was placed on Hunting Island, followed by the construction of six T-head groins in 2007, ranging in length from 130-143 m (CSE, 2008). The salt marsh from this study lies approximately 575 m north of groin 2 (Figure 2). The northerly longshore transport that dominates this region of the island means that the salt marsh is positioned downdrift of groin 2. This salt marsh had an area of approximately 49,300 m2 as of February 2013. The marsh area is generally triangular in shape, with its longest axis oriented in the same direction as the beach, northeast-southwest, and its shorter axis oriented perpendicular (Figure 3). Currently, there is little to no beach and/or dune boundary separating the wetland from the ocean. Figure 3 shows the extensive overwash lobes onto and into the salt marsh as a result of the absence of a protective dune and/or wide beach.
METHODS (Excerpts)
ArcGIS Analysis
Fifteen historical aerial photos from 1951-2013 were collected from various sources (Table 2). Images collected before 1994 were geo-referenced in ArcMap 10.1 (Esri software) relative to the Esri World Imagery basemap utilizing stable ground control points including road intersections, bridges and a lighthouse. The differing scales of these images led to varying root mean square errors (RMSE) (Table 2). Images acquired from the National Oceanic and Atmospheric Association and the Beaufort County, SC, Geographic Information Systems office dated 2006 and 2013 were previously ortho-rectified. Images acquired from Google Earth were geo-referenced by placing points at the four corners of an area encompassing the salt marsh, recording latitude and longitude values at each point, importing the image into ArcMap, and geo-referencing the image by manually entering coordinates for each corner. This method allowed for small RMSE values.
Separate baselines drawn parallel to shore and wetland/beach boundaries were drawn on chronologically successive photos to determine rates of retreat. Thirty randomly generated points were selected from the baseline for use in each set of photos. Distance measurements were made perpendicularly from each point on the baseline to the ocean edge of the wetland, delineated by vegetation using the aerial photos (Figure 4). The differences between distances of each point between photos were divided by time between photos to determine rates of marsh gain or loss. Means were calculated for chronologically successive images and for pre-groin and post-groin installation. Error was determined by measuring pixel length in each image and multiplying by three. This measurement expresses maximum error due to the inclusion of three pixels. This was done in order to incorporate differing quality of images and diffuse wetland boundaries, with an expected trend of error decreasing in modern images.
Wetland Delineation
Wetland status was determined through analysis of hydrology, hydric soil characteristics, and identification of hydrophytic vegetation. Specific wetland hydrology and hydric soil indicators were examined over the course of October 9-10, 2013. Vegetation data were collected in 2012 and are presented for the first time here. Identification of vegetation and percent cover was determined along four 50 m transects. Wetland vegetation indicator species were determined by comparing existing vegetation to the National Wetlands Plant List (USACE, 2013), which classifies plants on a spectrum of the probability they would exist in a wetland. Hydric soil indicators were determined using the NRCS Field Indicators of Hydric Soils in the United Sates (NRCS, 2010). In addition, existing soil data from the NRCS web soil survey (Soil Survey Staff, 2013) was consulted for previous soil descriptions. Hydrology indicators were determined using the USACE Wetland Delineation Manual (USACE, 1987). Salinity was measured using a portable salinity refractometer and a YSI 556 Multi Probe System. The USFWS National Wetland Mapper (2013) was utilized to determine previous wetland status and indicators.
RESULTS (Excerpts)
ArcGIS Analysis
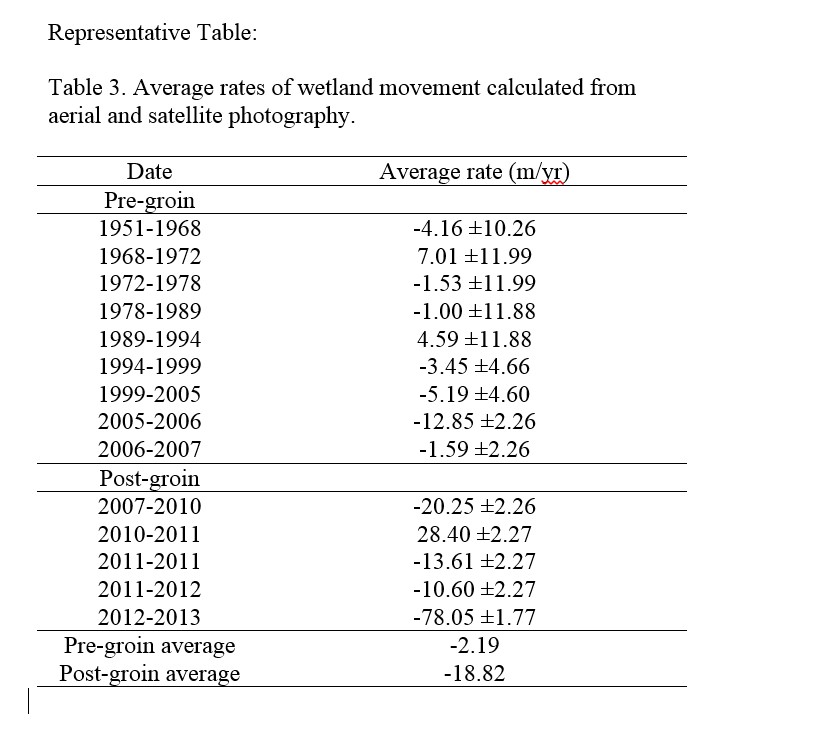
The average salt marsh retreat rates of the 30 distances measured between each baseline point are presented in Table 3. Of the 14 total average rates calculated, three sets (1968-1972, 1989-1994, 2010-2011) had a positive average value, indicating overall wetland gain for the 30 lengths measured. Eleven sets had a negative average value, indicating overall wetland loss for the 30 lengths measured. Pre-2007, or pre-groin installation, rates have narrow ranges, with extremes at +7.01 m/yr (1968-1972) and -12.85 m/yr (2005-2006). Generally, pre-2007 wetland retreat rates agree with reported Hunting Island erosion rates of 6 m/yr (CSE 2005; Stapor and May, 1981). Post-2007, or post-groin installation, values are more erratic and trend towards higher erosion rates. A rate of 28.40 m/yr for 2010-2011 is the only positive value post-groin installation. An average rate of -78.05 m/yr for the most recent set (2012-2013) is by far the largest rate measured. Retreat rates pre-groin and post-groin are statistically different (p <0.001), with post-groin rates indicating more rapid wetland loss (-18.82 m/yr average) (Table 4). In addition to average seaward edge retreat rates, wetland area was measured for each image used (Table 5). Aerial image wetland/upland delineation is not as clear as wetland/beach delineation, contributing to less accuracy than seaward edge retreat rates, but both methods generally agree. Positive retreat rates in 1989-1994 and 2010-2011 correlate with increased areas from these same years. However, decreasing area from 1968-1972 does not agree with positive value wetland retreat rates measured for this same time period. Rates of wetland distance gain/loss are plotted against rates of wetland area gain/loss (Figure 5). An r2 value of 0.518 shows moderate correlation between rates of wetland distance gain/loss and rates of wetland area gain/loss.
Wetland Delineation
The salt marsh studied was previously identified as a freshwater wetland in 1989 within the U.S. Fish and Wildlife Service’s National Wetlands Mapper (USFWS, 2013). The ranges of δ13C values obtained from the bottom 5 cm of organic soil cores indicate a more freshwater-influenced history (C3 plants). However, the U.S. Fish and Wildlife Service (USFWS) maps wetlands through aerial image analysis allowing for possible errors. In order to establish wetland status, hydrology, hydrophytic vegetation, and hydric soils must be present. A hydrologic connection to the ocean was clear from a tidal creek filling and draining the wetland at its southern edge (Figure 6). Salinity measurements within the wetland ranged from 31.2-32.5 ppt, values consistent with ocean water and inter-tidal salt marsh pore water (Mitsch and Gosselink, 2000). Hydric soil indicators were identified from eight cores collected at intervals along an 800 m transect through the center of the salt marsh using the NRCS Hydric Soils Indicators for region T which includes most coastal areas of the eastern US (2010).
DISCUSSION (Excerpts)
Prior to T-head groin installation, our measured average rates of wetland retreat (approximately 2 m/yr) generally agreed with Hunting Island retreat rates of approximately 6 m/yr reported by CSE (2005) and Stapor and May (1981), with less variation in pre-groin rates than post-groin rates (standard deviation pre-groin=11.56, post-groin=39.58). Rates with positive values pre-groin installation, indicating wetland gain, occurred in 1968-1972 (7.01 m/yr) and 1989-1994 (4.59 m/yr), coinciding with beach nourishment that occurred in 1968, 1971, and 1991 (Tables 1 and 3). However, it is important to again note that the wetland/beach boundary was delineated by vegetation. Therefore, although vegetation has advanced or re-gained area during sets with positive values, this is not necessarily equivalent to wetland gain. Spartina patens, a facultative wetland plant identified in the 2012 vegetation survey, is known to rapidly regenerate in overwash deposits (Wolner and others, 2013). The facultative wetland status and rapid regeneration of overwash deposits by Spartina patens could have led to positive rates calculated from aerial photographs that would not be delineated as wetland through ground truthing. A small retreat rate just prior to T-head groin installation for 2006-2007 (-1.59 m/yr) also coincides with nourishment in late 2006 that provided 492,535 m3 of fill. Wetland area increases from 1989-1994 and 2006-2007 agree with positive and very small negative rates, coinciding with beach nourishment (Table 5). The largest rate of wetland retreat measured pre-groin installation was -12.85 m/yr during 2005-2006 coinciding with severe beach erosion reported at Hunting Island as a result of Hurricane Ophelia on September 8th, 2005 (SC State Climatology Office, 2005; NOAA, 2005).
Much larger rates of wetland retreat were calculated post-groin installation (Table 3). Inherently, groins block the transport of sediment (Bruun, 1995; Galgano, Jr., 2004). The wetland studied lies approximately 575 m north of groin 2 (Figure 2). This area of Hunting Island is dominated by a northerly longshore sediment transport direction (CSE, 2013; May and Stapor Jr., 1996), placing the salt marsh in the downdrift direction. The reduction in sediment may leave the salt marsh more susceptible to erosion and overwash.
The completed vegetation survey demonstrated the study area’s specific hydrophytic vegetation, dominated by the primary macrophyte of southeast US salt marshes (U.S. Fish and Wildlife Service, 1990): Spartina alterniflora. Wetland hydrology at the site is evidenced by the tidal creek cutting into the salt marsh (Figure 6). This tidal creek drains directly from the marsh into the open ocean. Two NRCS indicators of hydric soil were identified in the study area – A3 Black Histic and A4 Hydrogen Sulfide. The reduction of sulfate to hydrogen sulfide in hydric soils is a common characteristic of coastal wetlands due to the steady supply of sulfate from the ocean (Vepraskas and Faulkner, 2001). The Black Histic indicator is partially determined by soil color, with a required value less than 3 and a chroma less than 2. These colors are characteristic of wetland soils, resulting from a buildup of organic matter and in which iron is reduced to a form that is colorless and soluble (Vepraskas and Faulkner, 2001).
CONCLUSIONS (Excerpts)
The study area was identified as a wetland by hydrophytic vegetation, hydric soil indicators, and wetland hydrology. The open tidal creek from the ocean into the salt marsh and the soil water salinity values show that the marsh is connected to the ocean. Therefore, the wetland is influenced by the ebb and flow of the tide and the studied salt marsh may have protection under federal law. Through analysis of 14 aerial images dating back to 1951 (Table 2), significantly different retreat rates were measured post-groin installation in 2007 compared to pre-groin, with an 8.6 times increased retreat rate occurring post-groin installation (Table 3). A total of 39,800 m2 of wetland area, representing 48% of the total area remaining pre-groin, have been lost from 2007-2013 (Table 5), post-groin installation. Qualitative analysis demonstrates the shoreline morphology of the northern one-third of Hunting Island State Park has been altered in the six years post-groin installation, from convex pre-groin to concave post-groin (Figure 8). The most recent image used overlaid with lines showing every determined wetland/beach interface demonstrates the rapid retreat of the salt marsh (Figure 9). Due to the increased rate of wetland retreat after installation of T-head groins on Hunting Island State Park, we conclude that effects on salt marshes should be analyzed in greater detail and potential impacts to these wetlands should be fully considered before permits are granted for these structures.
REFERENCES CITED (Excerpts)
Baird & Associates, 1998. Phase 1, Beach Restoration Alternatives, Hunting Island, South Carolina. Prepared for: South Carolina Department of Parks, Recreation & Tourism, 129 pp.
Bodge, Kevin, R., 2003. Design Aspects of Groins and Jetties. In: R. Moha, O. Magoon, M. Pirrello (eds.), Advances in Coastal Structure Design. Reston, VA: American Society of Civil Engineers, pp. 181-199.
Bruun, Per, 1995. The development of downdrift erosion. Journal of Coastal Research, 11(4), pp. 1242-1257.
Bulleri, F. and Chapman, M., 2010. The introduction of coastal infrastructure as a driver of change in marine environments. Journal of Applied Ecology, 47, pp. 26-35.
Chmura, G.L. and Aharon, P., 1995. Stable Carbon Isotope Signatures of Sedimentary Carbon in Coastal Wetlands as Indicators of Salinity Regime. Journal of Coastal Research, 11(1), pp. 124-135.
Representative Figure:
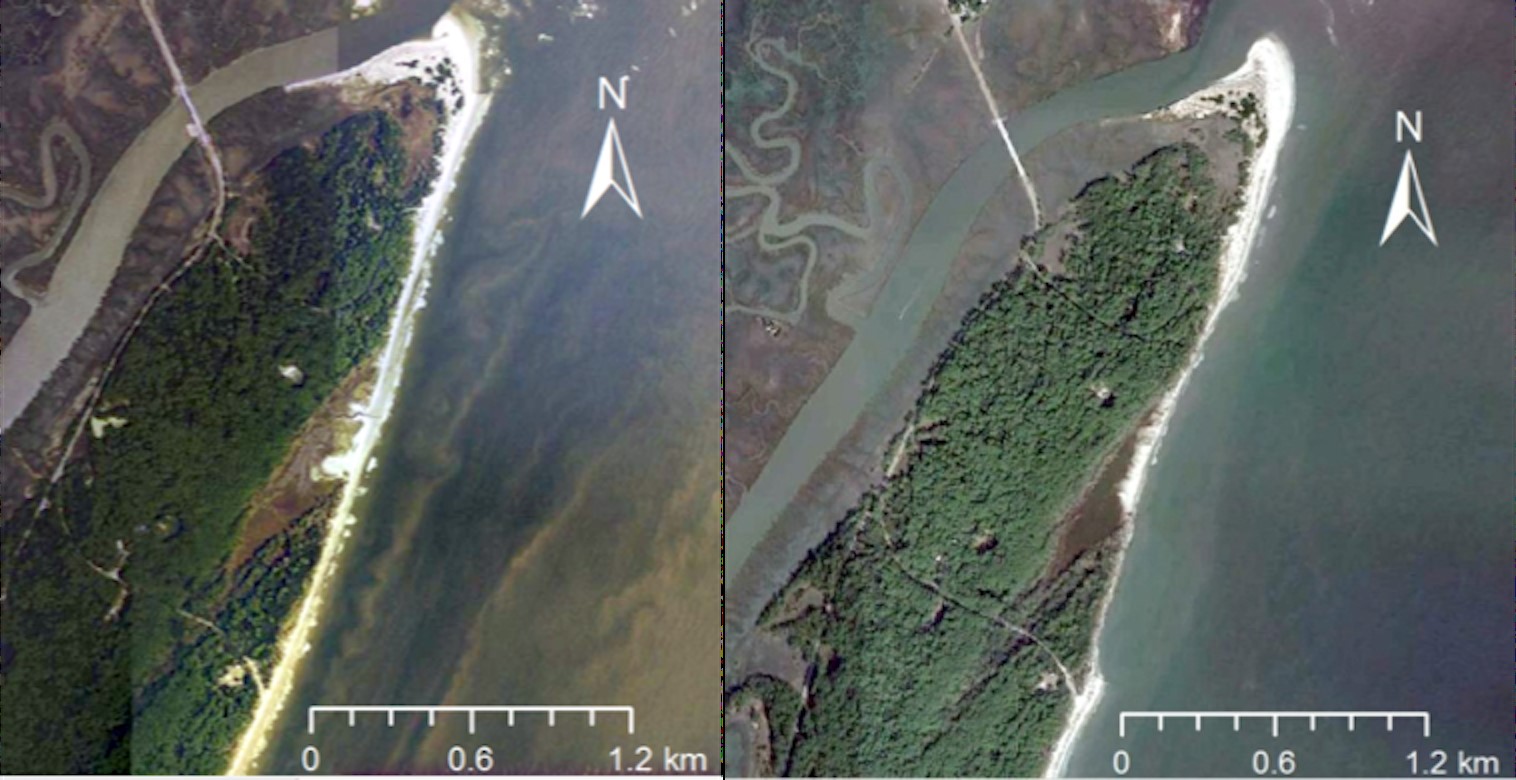
Figure 8. Aerial Images showing Northern Hunting Island including salt marsh in 2005 (left image) and 2012 after groin installation (right image). Note the changing shape of the beach/wetland interface from convex pre-groin to concave (erosional) post-groin.
Representative Table: